

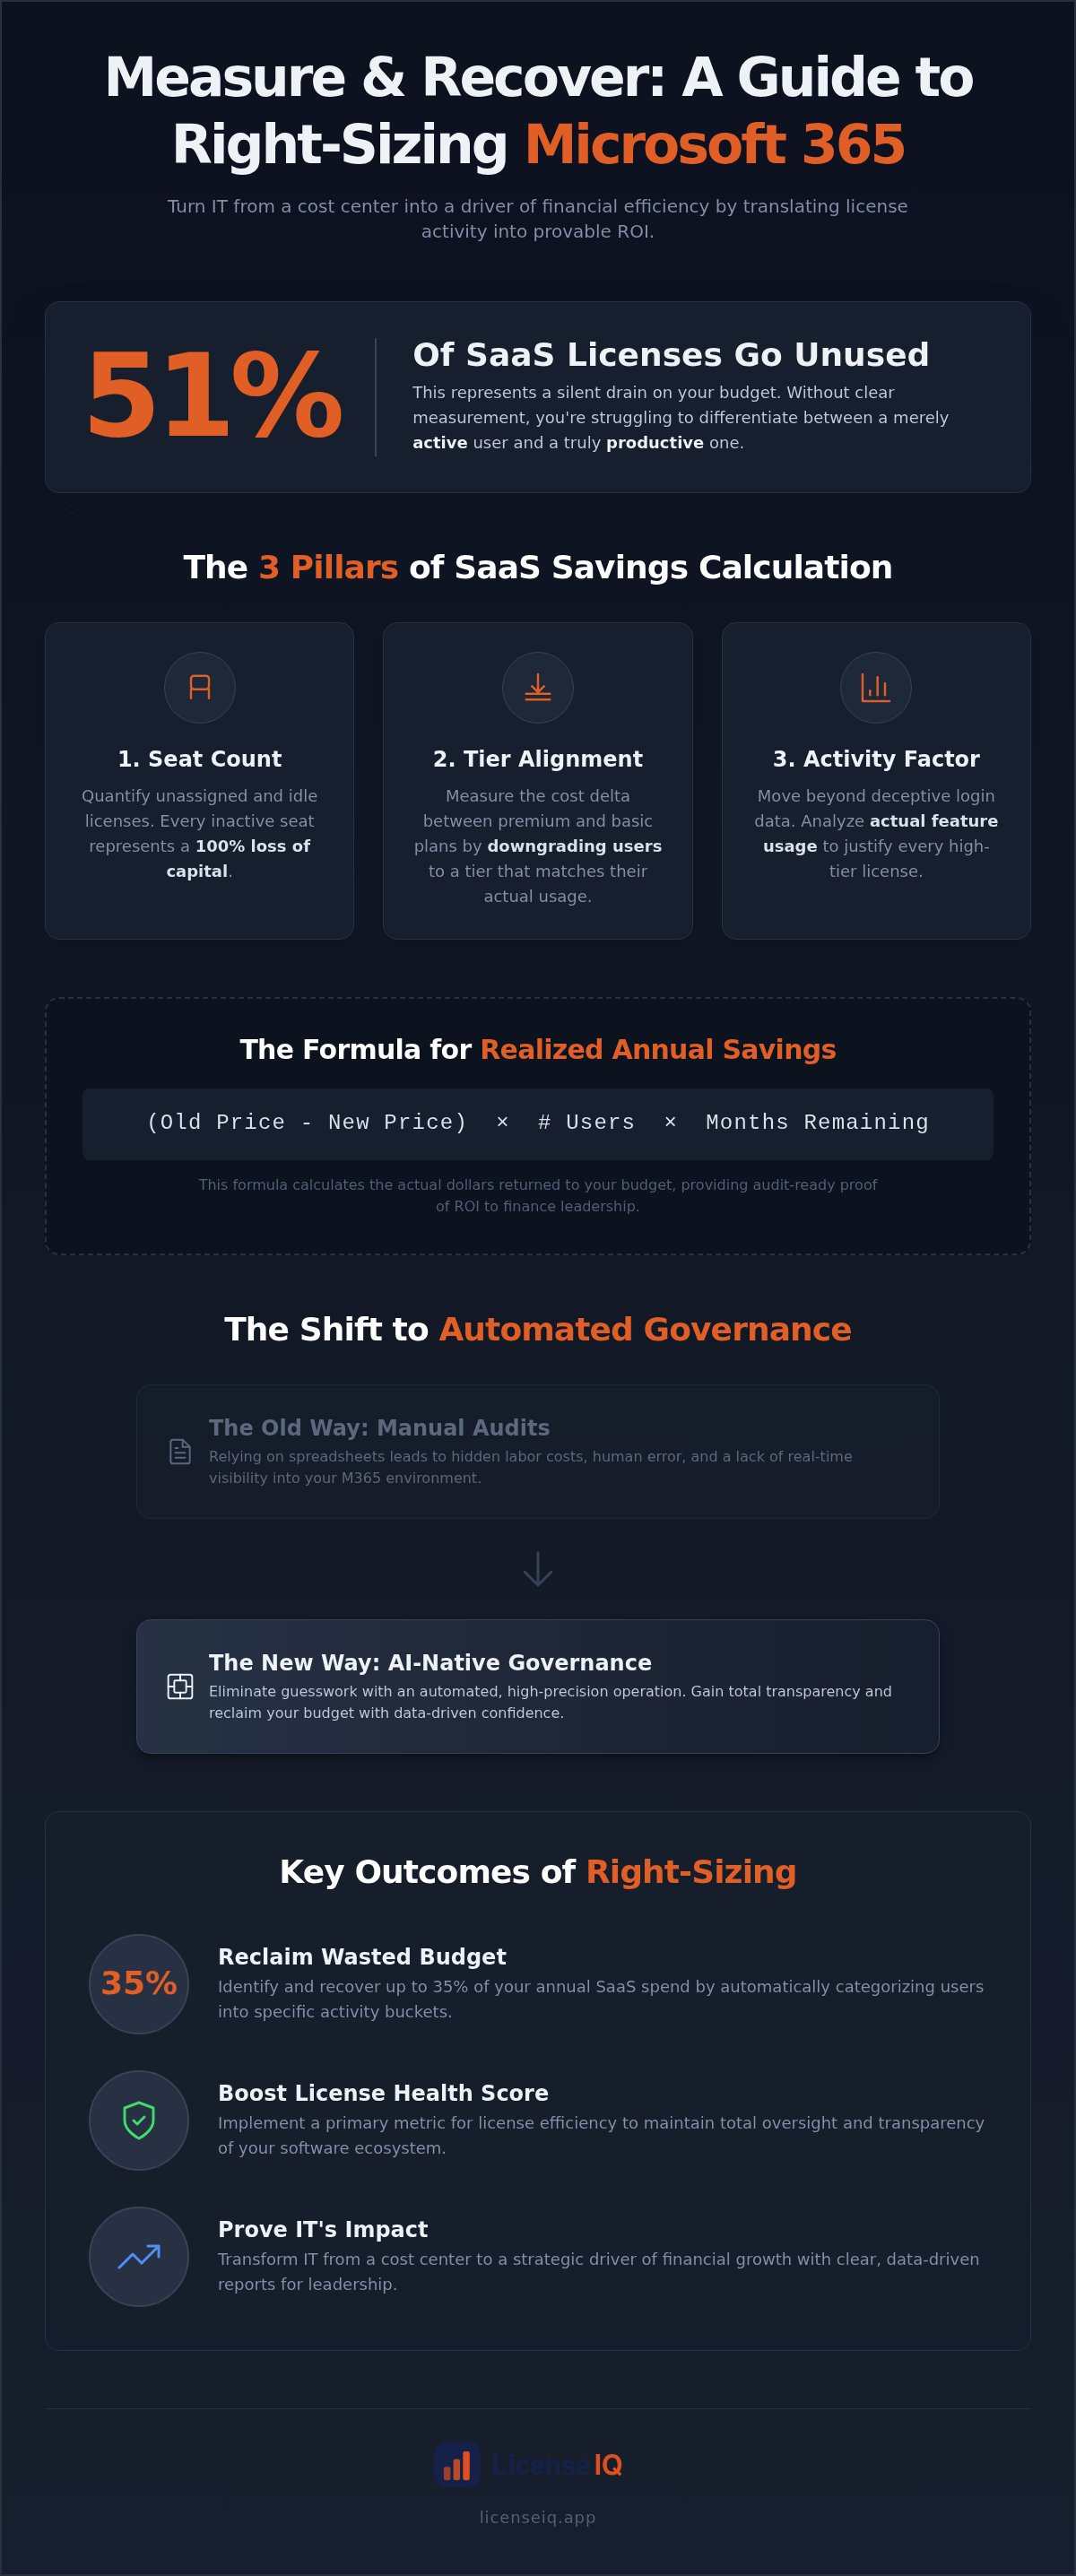
With Microsoft 365 Business Basic costs rising to $7.00 and Office 365 E3 hitting $26.00 as of July 2026, your IT budget is under intense scrutiny. It's a reality where 51% of SaaS licenses go unused. You must know how to measure savings from right-sizing microsoft 365 licenses to protect your margins and justify every seat. You're likely struggling to differentiate between a user who is merely active and one who is meaningfully productive. This lack of clarity creates organizational disorder and obscures the true value of your optimization efforts.
This playbook provides the precise financial formulas and methodologies you need to prove ROI to Finance. You'll master a repeatable framework for reporting recovery, ensuring your software Health Score remains high while you reclaim wasted spend. We'll explore the strategies needed to move away from manual spreadsheets and toward an automated, high-precision operation. By the end of this guide, you'll have the data-driven confidence to prove IT's impact on your company's growth.
Key Takeaways
- Define the gap between paid capacity and actual productivity to establish a clear financial baseline for your M365 environment.
- Master the exact formulas for Baseline vs. Optimized costs to learn how to measure savings from right-sizing microsoft 365 licenses with financial precision.
- Abandon manual spreadsheets for AI-native governance to eliminate the hidden labor costs associated with auditing complex tenants.
- Implement the License Health Score as your primary metric to maintain total transparency and oversight of your software ecosystem.
- Identify and reclaim up to 35% of wasted budget by automatically categorizing users into specific activity buckets.
The Economics of SaaS Right-Sizing: Why Measurement Matters
SaaS right-sizing is the surgical alignment of license costs with actual user requirements. It isn't a one-time project; it's a continuous discipline of ensuring your Microsoft 365 investment matches your team's daily reality. For modern SMBs, measurement serves as the essential bridge between IT operations and financial accountability. IT teams often see the technical utility of a license, while Finance sees only the line item. Data-driven measurement translates technical activity into financial impact, providing a common language for leadership.
The cost of "checked-out" users is a silent drain on your budget. These are employees who possess high-tier licenses but only utilize base-level features, or worse, have stopped using the suite entirely. Adopting a proactive Spend Recovery strategy allows you to treat these wasted fees as recoverable capital rather than inevitable overhead. When you understand how to measure savings from right-sizing microsoft 365 licenses, you transform IT from a cost center into a driver of financial efficiency.
Right-Sizing vs. License Reclamation
Effective Software Asset Management (SAM) requires a clear distinction between reclamation and right-sizing. Reclamation is the binary act of removing licenses from departed employees or totally inactive accounts. It's the "low-hanging fruit" of cost recovery. Right-sizing is more nuanced. It involves downgrading active users to a tier that matches their actual feature usage, such as moving a user from M365 E5 to Business Premium if they don't require advanced enterprise security. Measuring these separately is crucial for an accurate ROI report. It allows you to show Finance exactly where you've cut waste versus where you've optimized active productivity.
The Hidden Cost of Unchecked SaaS Sprawl
Redundant licenses accumulate rapidly during hiring surges or department restructuring. Without vigilant oversight, "zombie accounts" proliferate, creating security vulnerabilities and financial leaks. SaaS sprawl is the primary obstacle to operational transparency. It occurs when the rate of software procurement outpaces the organization's ability to track usage. This lack of insight leads to a 27% average waste in annual SaaS budgets for SMBs. By identifying how to measure savings from right-sizing microsoft 365 licenses, you eliminate this disorder. You replace obscured details with total clarity, ensuring your digital resources remain secure, lean, and fully utilized.
The 3 Pillars of SaaS Savings Calculation: Seats, Tiers, and Activity
Quantifying financial recovery requires a structured approach. You cannot manage what you do not measure. The framework begins with your Baseline Cost, the current monthly spend, versus your Optimized Cost, the projected spend after data-driven adjustments. Mastering how to measure savings from right-sizing microsoft 365 licenses depends on three specific pillars that define your software efficiency.
- Seat Count: This involves quantifying unassigned licenses. Every idle license represents a 100% loss of capital. Recovery starts by reclaiming these unused assets.
- Tier Alignment: This measures the delta between premium and basic plans. For instance, the price difference between an Office 365 E5 at $41.00 and an E3 at $26.00 is $15.00 per user, per month.
- Activity Factor: This moves beyond simple login data. It analyzes feature usage to justify downgrades. Login data is often deceptive. A user might log in daily but never touch the premium security or analytics features that justify an E5 tier.
By analyzing these pillars, you create a transparent map of your digital ecosystem. You can use a Spend Recovery Dashboard to visualize these deltas in real-time, replacing guesswork with audit-ready data.
The Formula for Realized Annual Savings
Realized savings are the actual dollars returned to the corporate budget. The formula is straightforward: (Old License Price - New License Price) x Number of Users x Months Remaining in the fiscal year. Potential savings are theoretical until the action is taken. Realized savings occur the moment the change reflects on your billing statement. To find your net recovery, you must subtract the one-time administrative labor cost required to execute the optimization. This ensures your ROI report stands up to scrutiny from Finance leadership.
M365 Specific: Measuring E5 to E3 or F3 Downgrades
The highest ROI often comes from downgrading E5 users. Many employees pay for advanced analytics and security suites they never open. Shifting these users to E3 or even F3 licenses can save significant capital. For example, as of August 2026, moving a deskless worker to an F3 license ($10.00) from an E3 ($26.00) yields an immediate $16.00 monthly saving per seat. You can compare specific features and limitations in our Microsoft 365 License Types guide to ensure no productivity is lost during the transition. This granular approach ensures every employee has exactly what they need, and the company pays for nothing more.
Manual Audits vs. AI-Native Governance: Comparing Measurement Methods
Manual methods fail because they rely on static snapshots of a dynamic environment. When you attempt to manually calculate how to measure savings from right-sizing microsoft 365 licenses, you fall into the "Spreadsheet Trap." By the time your IT team extracts data from the M365 Admin Center and formats it, the information is already obsolete. User activity changes daily. Subscriptions renew. New hires join. A manual audit is a rear-view mirror approach that creates organizational disorder and invites human error.
The labor cost of manual tracking is a significant, yet often ignored, drain on SMB budgets. High-salaried IT professionals spend hours cross-referencing CSV files and hunting for unassigned seats instead of executing strategic initiatives. Automated Governance Workflows have replaced these manual hurdles as the 2026 standard for operational accuracy. AI-native tools provide Real-Time Spend Recovery insights, allowing you to see exactly where capital is leaking the moment it happens. This shift from reactive auditing to proactive monitoring ensures your resources are always optimized and your financial health remains protected.
The Error Margin in Manual SaaS Tracking
Manual tracking introduces significant financial and operational risk. Stale data often leads to false positive savings reports, where IT claims recovery that hasn't actually occurred in the current billing cycle. Conversely, there is a dangerous risk of accidentally offboarding "quiet" users. These are critical employees who may not log in daily but perform essential periodic functions. Manual spreadsheets cannot differentiate between genuine inactivity and infrequent but vital usage. As your SMB grows, these errors compound. Manual tracking simply doesn't scale with the complexity of modern technical operations. It creates a false sense of security while waste continues to accumulate in obscured details.
Leveraging the License Health Score
The License Health Score is the definitive metric for measuring financial and operational efficiency. It consolidates complex usage data, tier alignment, and seat counts into a single, actionable number. This clarity is vital when reporting IT value to non-technical stakeholders like CFOs. Instead of presenting a 50-row spreadsheet that requires deep technical knowledge to interpret, you present a Health Score that proves your environment is lean and secure. You can find your specific score in minutes by connecting your tenant to the LicenseIQ Platform. This transparency establishes trust and proves you're a vigilant guardian of corporate resources. It moves the conversation from "how much do we spend?" to "how efficiently are we using what we have?"
Steps to Proving Your M365 Savings: A Framework for IT Leaders
Proving the value of IT optimization requires a repeatable framework that translates technical usage into financial recovery. You cannot rely on anecdotal evidence or subjective user surveys. Instead, mastering how to measure savings from right-sizing microsoft 365 licenses requires a data-driven sequence that moves from initial discovery to executive reporting. This framework ensures your software ecosystem remains lean while providing total transparency to the business.
- Step 1: Baseline Scan. Conduct a comprehensive scan of all M365 tenants. This establishes your starting point by identifying current license counts, plan tiers, and total monthly spend.
- Step 2: Activity Categorization. Segment your users into activity buckets. You must differentiate between Inactive users (zero activity), Under-utilizers (using basic features on premium plans), and Power Users (fully utilizing high-tier features).
- Step 3: Apply the License Health Score. Use this metric to prioritize your efforts. A low score indicates high waste, allowing you to target the most significant recovery opportunities first.
- Step 4: Execute Reclamation. Trigger Automated Governance Workflows to remove licenses from departed staff or accounts with prolonged inactivity. This eliminates the manual burden on your IT team.
- Step 5: Document Recovery. Use a Spend Recovery Dashboard to track realized savings month-over-month. This provides an audit trail of IT's direct impact on the bottom line.
Analyze your tenant baseline with LicenseIQ to start this process in minutes.
Identifying Wasted M365 Licenses
Precision in discovery is the foundation of recovery. You must first hunt for "Unassigned" licenses. These are seats you've already purchased but haven't assigned to a user, resulting in a 100% loss of capital every billing cycle. Next, flag accounts with zero activity in 30, 60, or 90-day windows. These represent immediate reclamation targets. Finally, audit your environment for double licensing. This occurs when a user is accidentally assigned an individual app license alongside a comprehensive bundle seat. Eliminating these redundancies is a critical step in learning how to measure savings from right-sizing microsoft 365 licenses accurately.
Reporting Savings to the CFO
Financial leadership values clarity over technical complexity. When reporting, focus on "Hard Savings," which are actual reductions in your monthly Microsoft invoice. Contrast this with "Avoided Costs," such as licenses you didn't have to purchase because you reclaimed existing idle seats. Use visual dashboards to show a clear downward trend in wasted spend. For long-term planning, integrate these insights into a broader M365 Cost Optimization strategy. This proactive approach proves that IT is not just monitoring resources but actively managing the organization's financial health.
Automating Spend Recovery with LicenseIQ: From Audit to Insight
Connecting your M365 tenant to the LicenseIQ Platform takes less than five minutes. This speed supports our 5-Minute Audit philosophy, designed specifically for busy SMB IT managers who require immediate clarity. You don't need to wait for weeks of data collection to understand how to measure savings from right-sizing microsoft 365 licenses. LicenseIQ provides an instant, comprehensive scan that surfaces obscured details manual audits consistently miss. By utilizing the Model Context Protocol, the platform powers Automated Governance Workflows that execute precise changes within your environment. It acts as a vigilant digital auditor, ensuring your organization never overpays for a seat again.
Continuous Monitoring vs. One-Time Cleanup
Right-sizing is not a project; it's a continuous state of operational hygiene. A one-time cleanup provides a temporary financial boost, but cost creep is inevitable without ongoing oversight. As your organization hires, restructures, or adopts new AI tools like Copilot, your licensing needs shift. Continuous monitoring ensures your License Health Score remains in the green. Automated alerts notify you of new spend recovery opportunities the moment they arise. This proactive approach eliminates the organizational disorder that typically follows rapid growth. You gain the peace of mind that comes from knowing your resources are under constant, precise monitoring.
Getting Started with Spend Recovery
You can discover your potential for recovery without an IT degree or complex training. The LicenseIQ Platform simplifies the administrative burden of license management while teaching you how to measure savings from right-sizing microsoft 365 licenses through real-time data visualizations. Start with a free initial scan to identify exactly where your budget is leaking. Our AI-native recommendations provide a clear roadmap for reclamation and tier alignment. This results-first methodology ensures that technical operations directly support the company’s financial health. By automating the transition from audit to insight, you reclaim your time and your budget simultaneously. Recover your wasted M365 spend with LicenseIQ today.
Secure Your Fiscal Future with Continuous Governance
You now possess the authoritative framework to eliminate organizational disorder and reclaim your IT budget. Mastering how to measure savings from right-sizing microsoft 365 licenses is no longer a manual burden but a strategic advantage for your leadership. By moving beyond static spreadsheets and adopting real-time oversight, you ensure every dollar spent on software drives meaningful productivity. This proactive approach transforms IT from a cost center into a vigilant guardian of corporate resources.
LicenseIQ provides the precise monitoring required to maintain this efficiency. Our AI-native scanning identifies up to 35% waste within minutes, while automated governance workflows handle the technical complexity on your behalf. We designed this platform specifically for SMB financial health, ensuring you remain one step ahead of price increases and license sprawl. It's time to replace lack of insight with total clarity and protect your organization's margins.
Stop wasting money on M365; Get your free License Health Score now.
Take command of your digital ecosystem and prove the undeniable ROI of your optimization efforts today.
Frequently Asked Questions
How do I calculate the ROI of a SaaS management tool?
Subtract the tool's cost and administrative labor from the realized savings identified during the audit. If the platform discovers $10,000 in annual waste and costs $2,000, your net ROI is 400%. You must also factor in the reclaimed time of your IT team. Automated systems eliminate the hundreds of hours spent on manual spreadsheets; this allows staff to focus on high-value security tasks. This efficiency gain is a critical component of total return.
What is the difference between potential and realized SaaS savings?
Potential savings represent theoretical recovery based on identified waste, while realized savings are the actual dollars removed from your invoice. Identifying an unused E5 license creates potential. Downgrading that seat to an F3 tier and seeing the reduced charge on your next Microsoft bill confirms the realization. You must track the date of implementation to report accurate fiscal year recovery to your Finance department and justify the optimization effort.
How often should I audit my Microsoft 365 licenses for right-sizing?
You should audit your environment monthly to prevent cost creep and license sprawl. Microsoft 365 environments are dynamic; users join, leave, or change roles constantly. Quarterly audits often miss the accumulation of "zombie accounts" that drain budgets for months. Continuous monitoring through an automated platform ensures your License Health Score remains high. It keeps your spend aligned with actual requirements without requiring constant manual intervention from your technical staff.
Can I measure savings from right-sizing without an automated tool?
It's possible but highly inefficient and prone to human error. You must manually export usage reports from the Microsoft 365 Admin Center and cross-reference them with billing data in spreadsheets. This method often results in stale data and missed opportunities. Learning how to measure savings from right-sizing microsoft 365 licenses manually requires significant labor hours. These hours often outweigh the value of the recovered spend, making it a poor choice for growing SMBs.
What are soft savings in the context of SaaS optimization?
Soft savings refer to non-cash benefits like reclaimed IT labor hours and improved security posture. When you automate license management, your team spends less time on administrative data entry. This reduction in labor cost is a soft gain because it doesn't appear as a lower invoice but increases operational capacity. Removing inactive accounts also reduces your attack surface. This provides a security benefit that's difficult to quantify but vital for organizational health.
Is it possible to automate the measurement of M365 license waste?
Yes, AI-native platforms use the Model Context Protocol to scan your tenant and identify waste automatically. These tools categorize users by activity and feature usage without requiring manual input. Automation provides a real-time view of your ecosystem, allowing you to trigger governance workflows the moment a license becomes idle. This ensures you maintain financial accuracy while knowing how to measure savings from right-sizing microsoft 365 licenses with total precision and minimal effort.
How does right-sizing licenses impact employee productivity?
Right-sizing improves productivity by ensuring every user has the specific tools required for their role. It isn't about cutting access; it's about matching tiers to actual needs. For example, a frontline worker doesn't need the enterprise analytics of an E5 plan to perform their duties. When licenses are aligned correctly, IT can allocate the saved budget toward high-impact tools or AI subscriptions that actually enhance the team's daily output.
What metrics should I include in a SaaS spend recovery report?
Your report should include the License Health Score, total realized savings, and the count of reclaimed unassigned seats. You should also highlight the delta between your baseline spend and your optimized monthly cost. Including these metrics demonstrates IT's commitment to financial transparency. Using a Spend Recovery Dashboard allows you to present these data points visually. This makes the impact of your optimization efforts clear to non-technical stakeholders like the CFO.


