97% of Fortune 500 companies rely on Power BI, yet many mid-market IT leaders are still hemorrhaging budget on idle Fabric capacities and redundant seats. Following the 2025 price hike to $14 per Pro user, an unoptimized environment isn't just a nuisance; it's a financial liability. You need a rigorous power bi license optimization strategy to stop the leak. It's frustrating to realize you are paying for Pro licenses for users who only view reports, or worse, double-paying for seats already included in your Microsoft 365 E5 subscriptions.
You deserve total clarity over your software spend. This framework allows you to master a data-driven approach to eliminate Power BI waste and align licensing costs with actual user activity using automated workflows. We will show you how to right-size your Fabric F-SKUs and implement a repeatable process for renewal negotiations. This guide moves beyond manual spreadsheets to provide a proactive system for seat governance. By the end, you will have the tools to transform your analytics environment from a growing cost center into a lean, high-efficiency operation that scales with your business.
Key Takeaways
- Transition from rigid per-user models to Microsoft Fabric F-SKUs to capitalize on capacity-based scaling.
- Expose the "Usage Gap" by auditing actual report creation activity rather than relying on deceptive sign-in metrics.
- Execute a power bi license optimization strategy by identifying the specific financial tipping point between Pro seats and Fabric capacity.
- Deploy automated governance workflows to establish waste thresholds and reclaim underutilized licenses in real-time.
- Utilize the LicenseIQ Platform to generate a License Health Score and prioritize immediate spend recovery actions.
The 2026 Power BI Licensing Landscape: Why Strategy Trumps Luck
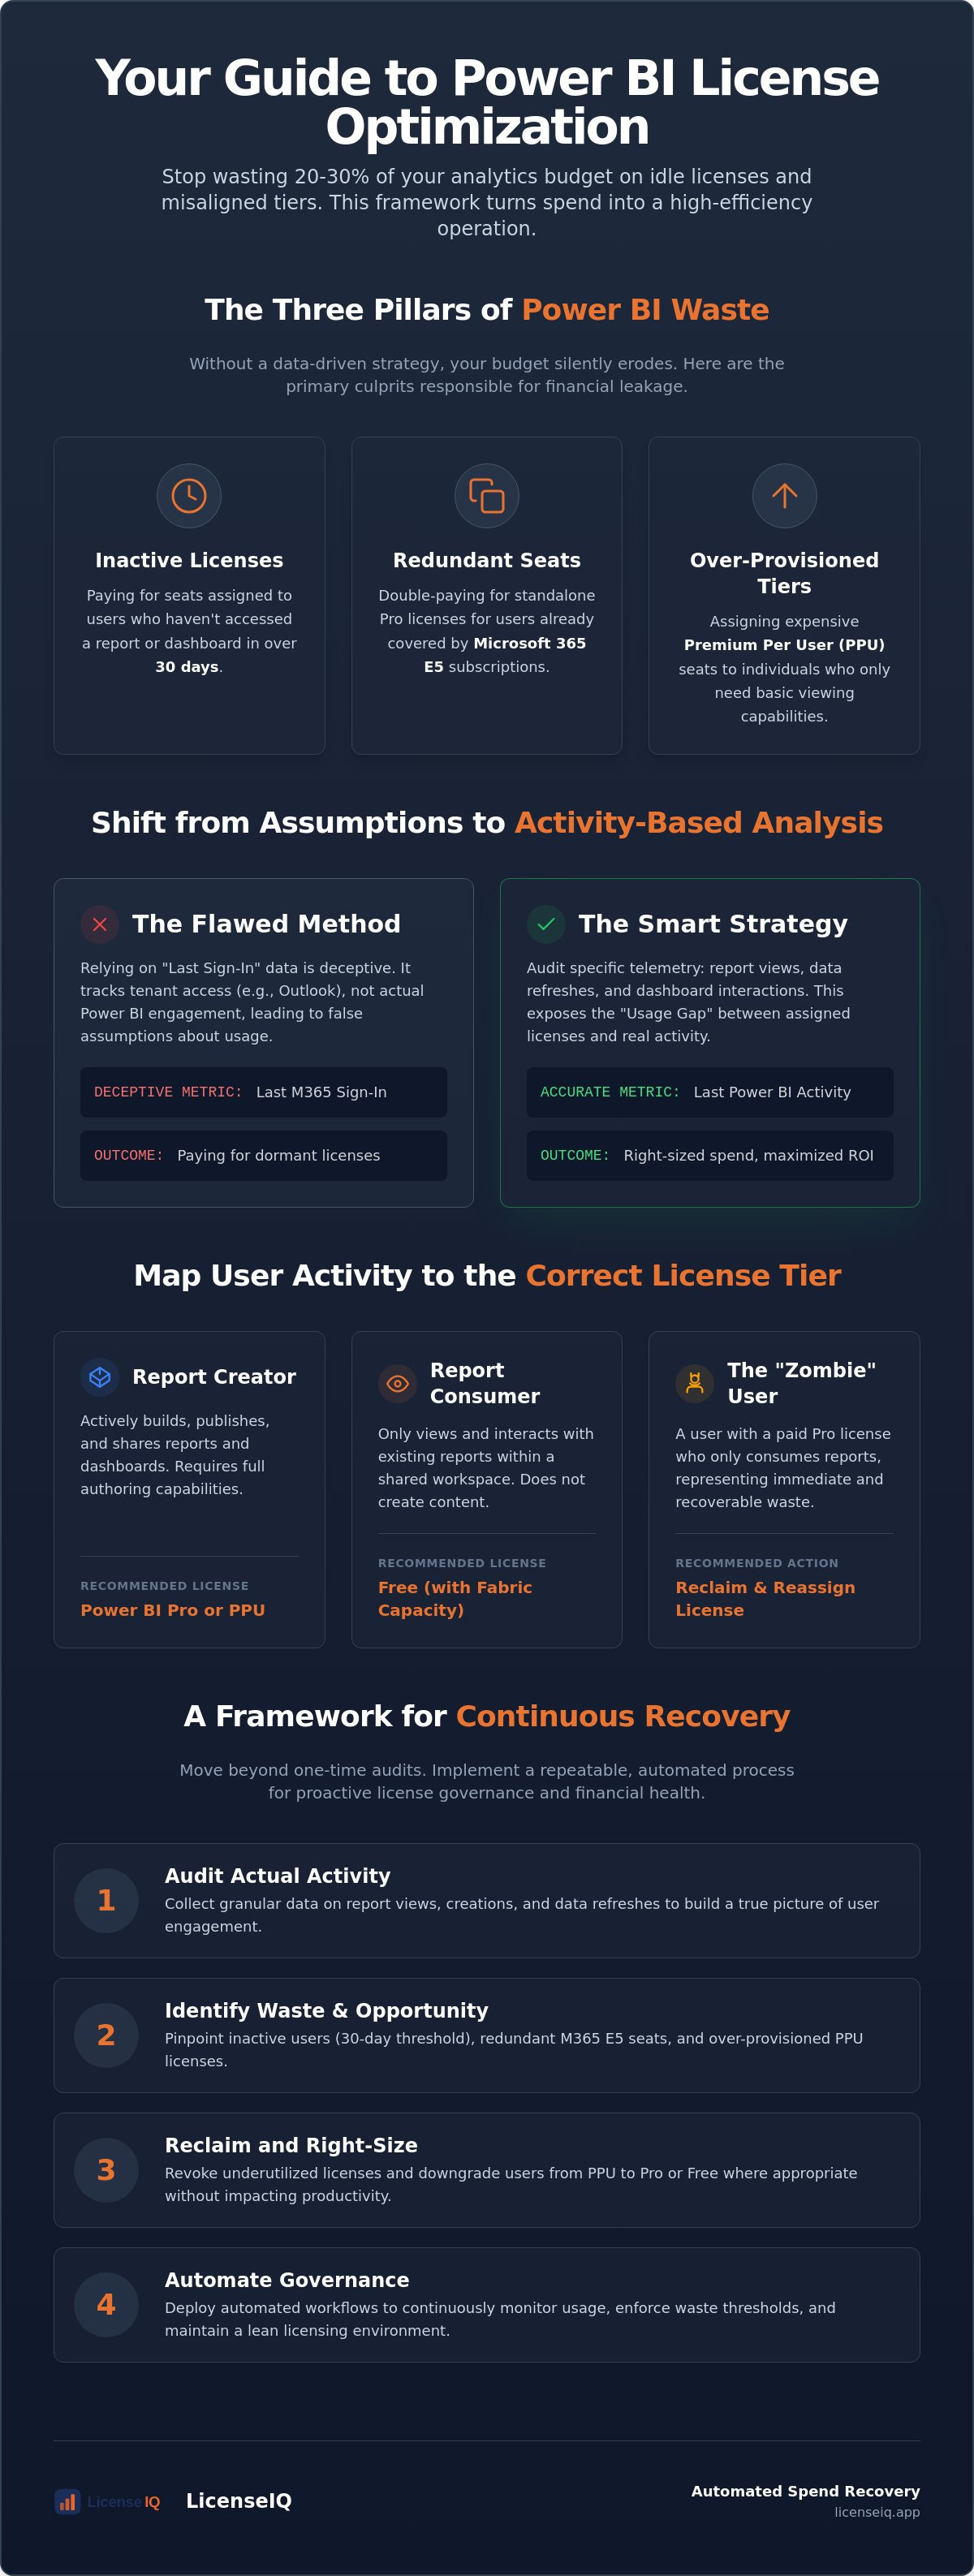
Luck is not a management tactic for Microsoft’s evolving ecosystem. In 2026, the complexity of Power BI licensing models has reached a point where manual oversight is no longer viable. Mid-market IT leaders often default to "safe" licensing, which usually means paying for the highest tier regardless of actual usage. A robust power bi license optimization strategy replaces this guesswork with precise telemetry. Without it, you are likely losing 20% to 30% of your analytics budget to three specific pillars of waste:
- Inactivity: Licenses assigned to users who haven't accessed a report in over 30 days.
- Redundancy: Paying for standalone Pro seats for users who already have access through Microsoft 365 E5 subscriptions.
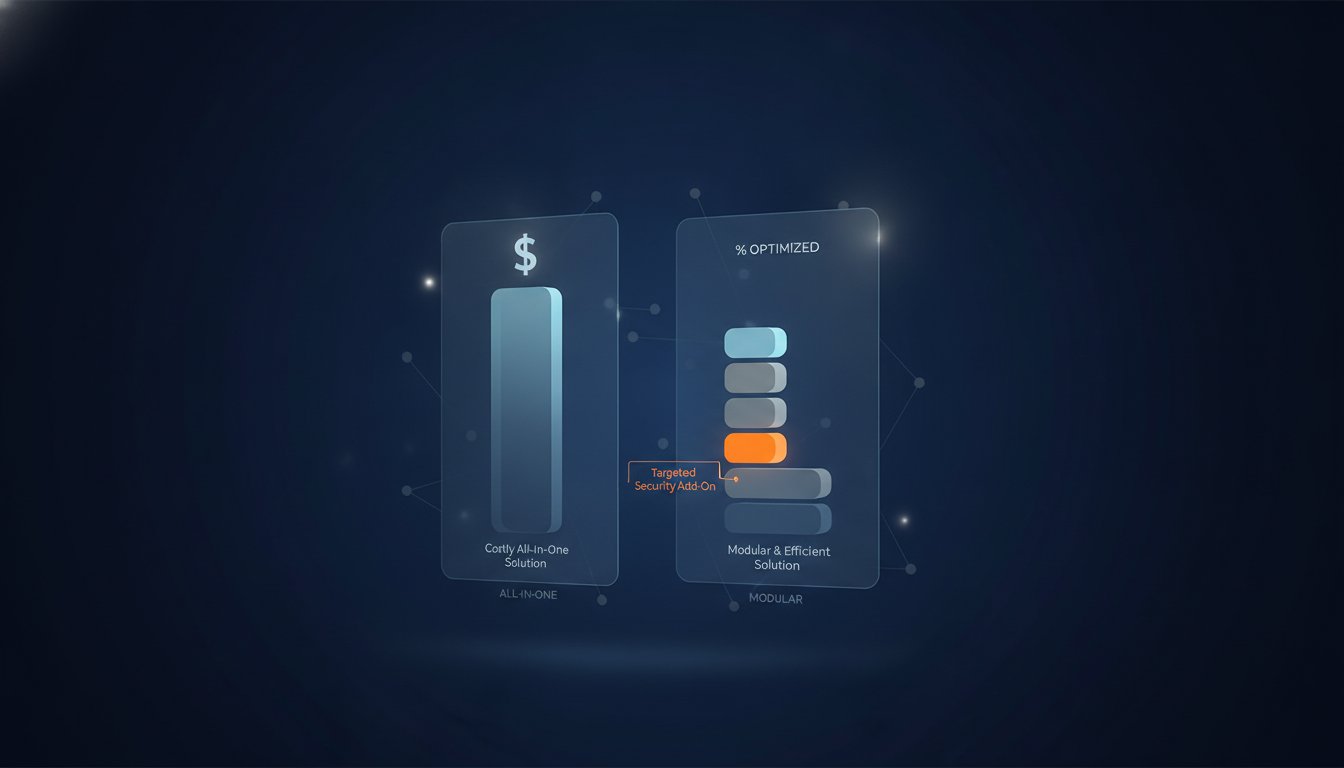
- Over-provisioning: Assigning expensive Premium Per User (PPU) seats to individuals who only require basic viewing capabilities.
Manual tracking fails because the 2026 hybrid data environment moves too fast. Users join, change roles, or leave projects, but their licenses remain attached like digital barnacles. You need a system that monitors these shifts in real-time to maintain financial health.
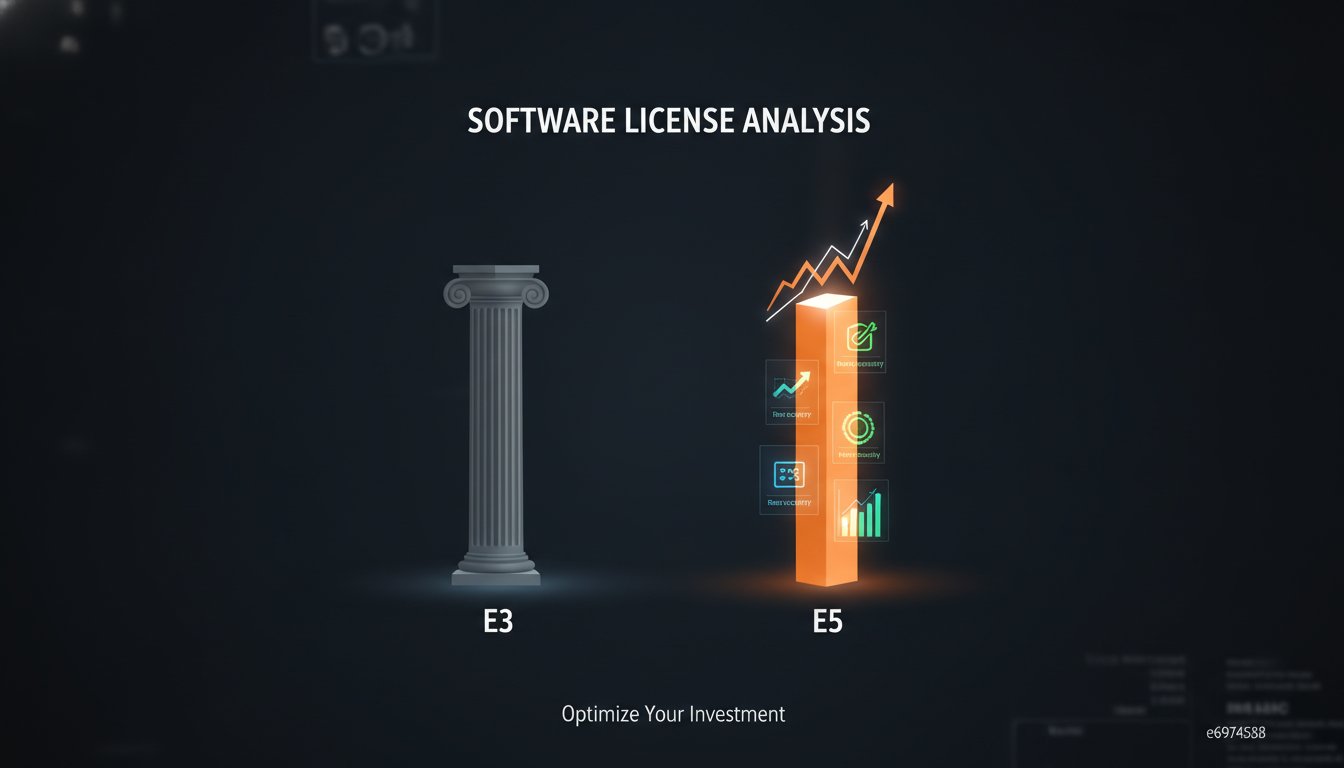
Pro vs. Premium vs. Fabric: The 2026 Choice
The 2025 price adjustments solidified Power BI Pro at $14 per user and PPU at $24. For small, isolated teams, Pro remains the standard entry point. However, PPU becomes a financial liability when scaled across an entire department without a specific need for advanced AI or paginated reports. The enterprise market has shifted decisively toward Microsoft Fabric F-SKUs. These capacity-based models allow you to license compute resources rather than individual users. While Fabric offers massive scaling potential, it requires active governance. If you provision an oversized Fabric capacity that sits idle, you've simply traded per-user waste for infrastructure waste. Success requires balancing these tiers based on actual activity data.
The Financial Impact of "License Drift"
License drift is the silent erosion of your IT budget. It happens when seat assignments remain static while user engagement drops. Over a 12-month cycle, unmonitored assignments can bleed thousands of dollars from your bottom line. There is a direct correlation between low adoption metrics and high license waste. To stop the bleed, 2026 renewals require a 90-day lead time for comprehensive data collection. You cannot negotiate effectively with Microsoft using "gut feelings" or outdated spreadsheets. You need granular data on who is creating, who is consuming, and who hasn't logged in since the last quarter. Utilizing the LicenseIQ Platform provides the visibility needed to identify these gaps. Total transparency is your only defense against organizational disorder.
Auditing the Usage Gap: Activity-Based Analysis vs. Role-Based Assumptions
Reliance on "Last Sign-In" dates is a critical failure in most IT audits. This metric is deceptive because it only tracks when a user accessed the Microsoft 365 tenant, not when they engaged with Power BI. A user might log in daily to check Outlook or Teams while their $14 per month Power BI Pro license sits dormant. A high-performance power bi license optimization strategy requires shifting from role-based assumptions to activity-based analysis. You must look beyond the login and examine specific telemetry: report views, data refreshes, and dashboard interactions.
Effective auditing differentiates between Report Consumers and Report Creators. Creators actively build and publish content, requiring a Pro or PPU license. Consumers only need to view data. If your organization uses Microsoft Fabric capacity, these consumers do not require individual paid seats. Identifying "Zombies" is your first priority. These are users with Pro licenses who only view content in workspaces that could be served via Fabric. By reclaiming these seats, you eliminate immediate waste without impacting productivity. A 30-day activity threshold serves as the definitive benchmark for license reclamation; if a user has not interacted with a report in a month, the license should be revoked and returned to the pool.
Mapping Activity to the Correct License Tier
Analyze your Premium Per User (PPU) population with scrutiny. Many users are assigned PPU seats by default but never utilize advanced AI capabilities or paginated report features. These users are prime candidates for a downgrade to Pro or even a Free tier if they operate within a Fabric capacity. The Activity Gap is the delta between assigned features and utilized tools. Identifying these overlaps manually is a drain on resources; however, you can automate the process through a Spend Recovery Dashboard to see immediate savings and prioritize your efforts.
Eliminating the M365 E5 Duplication
The "E5 Trap" is a common source of financial leakage in mid-market organizations. Microsoft 365 E5 subscriptions already include a Power BI Pro license. Despite this, IT departments frequently assign standalone Pro licenses to users who are already covered by their E5 seat. This results in double-paying for the same functionality. To solve this, you must cross-reference your Entra ID (formerly Azure AD) groups with your Power BI assignment tables. Ensuring your users are mapped to the correct Microsoft 365 license types prevents this redundancy. This level of oversight is the cornerstone of a mature power bi license optimization strategy, ensuring every dollar spent on the Power BI ecosystem is backed by verified user activity.
Strategic Right-Sizing: Fabric Capacity vs. Per-User Economics
Identifying your users is only the first step; calculating the financial logic of your infrastructure is where the real savings occur. A successful power bi license optimization strategy hinges on finding the "Tipping Point." This is the exact moment when the cumulative cost of individual Pro or PPU seats exceeds the monthly investment of a Microsoft Fabric F-SKU. With Power BI Pro priced at $14 per user as of mid-2025, an organization with 500 report viewers is often better served by Fabric capacity. In this model, you pay for compute power rather than individual access rights, effectively decoupling your costs from your headcount.
Fabric capacity also introduces "Capacity Smoothing." This feature averages out high-intensity compute spikes over a 24-hour period. It prevents you from having to provision for your absolute peak usage, which is a common mistake that leads to over-provisioning. By leveraging burstable capacity, you can handle intensive data refreshes without being forced into a higher, more expensive tier. This level of control allows for precise 2026 budget forecasting that remains resilient against fluctuating user engagement.
Choosing the Right F-SKU for Your Workload
Microsoft offers a wide range of Fabric capacities, from F2 to F2048. Matching these compute units to your actual query peak times is vital. Many IT leaders over-provision for "peace of mind," but this is frequently a $10,000 mistake. An F2 SKU starts at approximately $262 per month, making it an accessible entry point for smaller workloads. You should use automated alerts to trigger capacity right-sizing. If your telemetry shows consistent 90% utilization, it's time to scale up; if you're hovering at 20%, you're wasting resources. Total transparency in compute usage ensures you never pay for idle hardware.
Reserved Instances and Long-Term Savings
Commitment pays dividends in the Microsoft ecosystem. While Pay-As-You-Go offers flexibility, the ROI of 1-year or 3-year reserved instances is undeniable. Reserved pricing can provide discounts of 40% or more compared to standard rates. You must balance this need for long-term savings with the flexibility your business requires. If your data strategy is mature and your usage is predictable, locking in a reserved F-SKU is the most efficient path forward. This approach mirrors broader Microsoft 365 cost optimization tactics that prioritize spend recovery through strategic commitments. Don't let your budget drift through indecision; lock in the rates that reflect your actual operational needs.
Implementing a Continuous Spend Recovery Framework
Static audits are obsolete. A modern power bi license optimization strategy requires a repeatable, five-step recovery framework that operates in real-time. You cannot rely on annual reviews to manage a 2026 data environment. Instead, you must implement a system that identifies waste as it happens and recovers spend automatically. This proactive approach ensures your analytics budget remains lean and your resources stay focused on active users.
The framework follows a logical, data-driven progression:
- Step 1: Connect to the tenant. Establish a secure connection for real-time telemetry. This provides the raw data needed to track actual feature utilization across your entire user base.
- Step 2: Define "Waste Thresholds." Set clear parameters for reclamation. If a Pro or PPU user has not engaged with a report for 30 days, they should be flagged for license removal.
- Step 3: Automated Reclamation. Deploy Automated Governance Workflows to notify users and reclaim dormant seats. This removes the administrative burden from IT and ensures immediate savings.
- Step 4: Monthly "Right-Size" Reviews. Analyze your Fabric F-SKU performance every 30 days. Adjust your capacity based on verified compute peaks rather than speculative growth.
- Step 5: Executive Reporting. Use a Spend Recovery Dashboard to visualize ROI. Presenting hard data on reclaimed licenses and cost avoidance justifies your governance efforts to leadership.
Execution is the difference between a plan and a result. You can start this process today by deploying the LicenseIQ Platform to gain instant visibility into your current spend trajectory.
Automating the Offboarding Process
Power BI licenses are frequently forgotten during employee offboarding. When a user leaves, their license often remains active in the tenant, bleeding budget for months. You must integrate license reclamation into your standard HR exit workflow. This ensures that every seat is returned to the pool the moment an account is disabled. For a broader view of this process, consult our Office 365 offboarding checklist to secure your data and protect your budget.
Setting Up Governance Guardrails
Shadow IT is a primary driver of license sprawl. To maintain control, you must restrict "Self-Service Purchase" options within the Microsoft admin center. This forces all license requests through a centralized approval workflow. Automated governance prevents privilege creep by ensuring users only retain high-tier access while actively utilizing advanced analytics features. This layer of oversight ensures that your power bi license optimization strategy remains effective long after the initial audit is complete.
Executing Your Strategy with LicenseIQ Automated Workflows
Manual oversight is the enemy of efficiency. While the frameworks discussed in previous sections provide a roadmap, the LicenseIQ Platform provides the engine for execution. You can transition from theoretical planning to verified savings in minutes. LicenseIQ connects directly to your tenant, delivering a comprehensive audit of your Power BI environment in under five minutes. This rapid assessment replaces weeks of manual data collection and spreadsheet reconciliation, providing immediate clarity in a complex operational landscape.
Your optimization efforts are guided by the License Health Score. This proprietary metric prioritizes your savings opportunities by quantifying the efficiency of your current assignments. It exposes the obscured details of your tenant, such as users who have never accessed a report despite holding a $14 per month Pro seat. By interpreting this score, you can focus your power bi license optimization strategy on the areas with the highest financial impact first. Maintaining financial hygiene becomes a background process rather than a recurring administrative burden.
AI-native workflows handle the heavy lifting of spend recovery. Instead of IT staff manually emailing users to justify their license usage, LicenseIQ automates these interactions. The system identifies waste, triggers notification workflows, and reclaims licenses based on your predefined thresholds. This proactive stance ensures that your resources are always monitored by a vigilant and precise system, protecting your budget from the silent erosion of license drift.
From Insights to Actionable Spend Recovery
Dashboards are only useful if they lead to action. LicenseIQ moves beyond simple visualization to provide automated license governance. The platform automatically identifies redundant Pro licenses within E5 tenants, solving the "double-paying" problem mentioned earlier. You can track every dollar saved through the LicenseIQ Spend Recovery Dashboard. This tool provides total transparency, allowing you to report the exact ROI of your optimization efforts to executive leadership. It transforms organizational disorder into a lean, data-driven operation.
The Future of AI-Driven FinOps
The 2026 landscape demands deeper integration. LicenseIQ leverages the Model Context Protocol for seamless Microsoft 365 integration, ensuring that your governance guardrails are always in sync with your broader IT ecosystem. Mid-market organizations use LicenseIQ to achieve enterprise-level optimization without the massive headcount typically required for manual FinOps. You don't need a dedicated team of auditors when you have an active participant in your company's growth. Take the first step toward total resource oversight and get your free License Health Score today. Stop the bleed and start recovering your wasted analytics spend now.
Secure Your Analytics Budget for 2026
Efficiency in the Microsoft ecosystem is no longer optional. You've seen how shifting from role-based assumptions to activity-based telemetry exposes the "Usage Gap" that drains IT budgets. By identifying the financial tipping point between Pro seats and Fabric capacity, you position your organization for scalable growth without unnecessary overhead. Implementing a comprehensive power bi license optimization strategy is the only way to protect your bottom line from rising SaaS costs while maintaining total operational transparency.
The transition from organizational disorder to total clarity takes less time than you think. You can identify up to 35% in wasted M365 spend using AI-native automated governance workflows built specifically for mid-market efficiency. Stop guessing and start recovering your resources with a system that stays one step ahead of license drift. Start your 5-minute Power BI audit with LicenseIQ to reclaim your budget today. You have the framework and the tools to turn your analytics environment into a model of financial health. Take the lead and secure your resources now.
Frequently Asked Questions
How do I identify users who have both a Power BI Pro license and an M365 E5 license?
Cross-reference your Entra ID groups with your Power BI assignment tables to find these overlaps. Standalone Pro licenses are redundant for these users because the M365 E5 seat already includes Power BI Pro. Eliminating these duplicate assignments is an immediate way to reclaim wasted spend.
Is Microsoft Fabric cheaper than buying individual Power BI Pro licenses?
Fabric becomes more cost-effective once you reach a specific user tipping point, typically around 500 report viewers. It decouples your costs from your headcount by using capacity-based compute. This allows an unlimited number of viewers to access reports without requiring individual $14 per month Pro seats.
What happens to a user’s reports if I reclaim their Power BI Pro license?
The reports remain securely in the workspace and are not deleted. However, the user loses the ability to publish new content or edit existing reports. If the workspace is hosted in a Fabric capacity, the user can still view the reports using a free license.
Can I use Power BI Free licenses for users who only need to view reports?
Yes, but only if the content is hosted within a Microsoft Fabric or Premium capacity. If you aren't using capacity-based licensing, every viewer must have a paid Pro or PPU license to access shared reports. This is a common source of license sprawl in unmonitored environments.
How often should I conduct a Power BI license audit in 2026?
Continuous monitoring is the only way to stay ahead of license drift. While you should implement a real-time power bi license optimization strategy, you should also conduct formal monthly reviews of your Fabric capacity. This ensures your compute resources match your actual peak usage periods.
Does Power BI Premium Per User (PPU) include all the features of Microsoft Fabric?
No, PPU is strictly a per-user license for advanced Power BI features like paginated reports and AI visuals. Microsoft Fabric is a unified data platform. It includes Power BI capacity alongside data engineering, warehousing, and data science tools under a single F-SKU.
What is the best way to track Power BI usage metrics for license optimization?
Use real-time telemetry from the Power BI tenant rather than deceptive "Last Sign-In" dates. Focus on specific activity metrics like report views, dashboard interactions, and creation events. This granular data reveals the delta between assigned features and utilized tools.
Can I automate the removal of inactive Power BI licenses?
You can automate this process by deploying Automated Governance Workflows. These systems monitor user activity and automatically revoke licenses after a defined period of inactivity, such as 30 days. This keeps your license pool lean without requiring manual intervention from IT staff.