

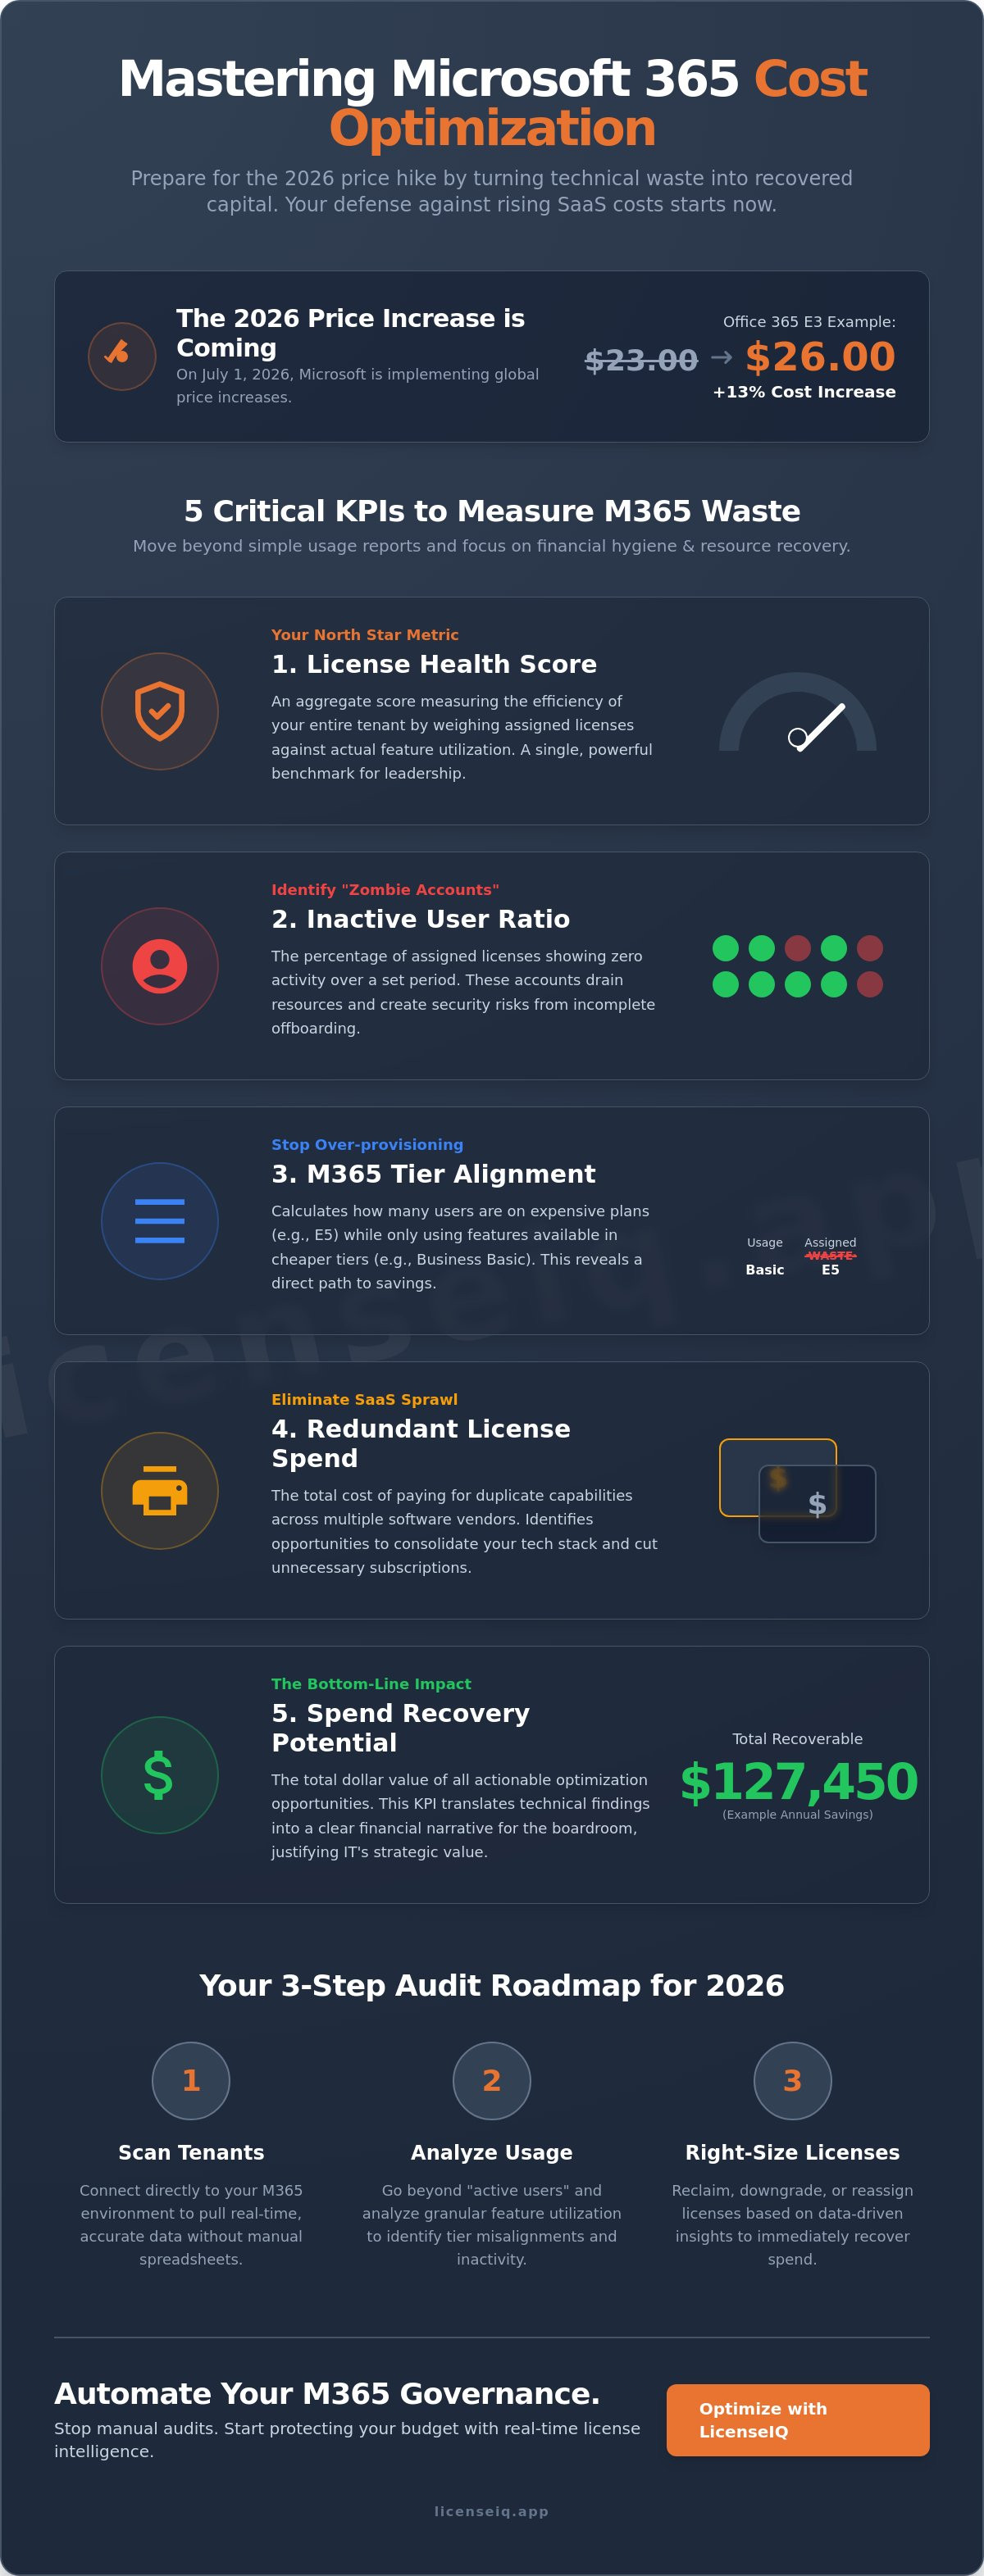
What if your next Microsoft renewal cost 13% more without adding a single new user? On July 1, 2026, Microsoft will implement global price increases, including a jump for Office 365 E3 from $23.00 to $26.00. If you can't quantify your waste now, you're walking into that renewal blind. Tracking the right microsoft 365 cost optimization kpis is no longer an optional IT task; it's a financial necessity for protecting your organization's margins.
It's frustrating to watch SaaS sprawl expand while leadership demands leaner operations. You see the inactive accounts and redundant licenses, but translating that technical clutter into a compelling business case is difficult. This article changes that. You'll learn how to master the financial metrics that turn technical waste into boardroom-ready reports. We'll provide a framework to present a bulletproof case for spend recovery and show you how to leverage a License Health Score to automate your data collection. It's time to stop reporting on "users" and start reporting on recovered capital.
Key Takeaways
- Transition from measuring simple adoption to quantifying financial impact through specialized license intelligence.
- Identify the five critical microsoft 365 cost optimization kpis that reveal the gap between paid seats and actual usage.
- Utilize a three-slide framework to present spend recovery data as a strategic contribution to the company's bottom line.
- Implement automated governance to eliminate manual auditing and ensure your License Health Score remains optimized.
- Follow a structured audit roadmap to scan tenants, analyze feature usage, and right-size your licensing tiers for 2026.
Defining Microsoft 365 Cost Optimization KPIs for the 2026 Economy
The 2026 business environment demands a pivot. The era of growth-at-all-costs has ended, replaced by a mandate for total operational efficiency. IT leaders are no longer just service providers. They are financial stewards. To succeed, you must move beyond basic usage reports and implement specific microsoft 365 cost optimization kpis that align with fiscal objectives. These metrics provide the transparency needed to protect margins as SaaS costs continue to climb.
A standard Key Performance Indicator (KPI) usually tracks technical activity or system uptime. In contrast, cost optimization KPIs focus on financial hygiene and resource recovery. Manual spreadsheets are the primary enemy of this process. They offer static snapshots of a moving target. They are often riddled with human error and become obsolete the moment they are saved. Real-time accuracy requires automated governance. By connecting directly to your tenant, platforms like LicenseIQ transform raw data into actionable intelligence without the manual burden.
The Difference Between Adoption Metrics and Efficiency Metrics
"Active Users" is a misleading metric for financial health. A user might be active on an expensive E5 license while only utilizing features available in a Business Basic plan. This creates a gap between cost and value. Efficiency metrics prioritize "Spend Recovery." This is a proactive financial strategy. It identifies exactly where capital is being trapped in underutilized seats. High efficiency scores directly improve company EBITDA. They prove that IT is actively reducing unoptimized overhead rather than just managing a budget.
Why Leadership Demands Better SaaS Oversight Now
SaaS sprawl now directly impacts corporate valuations. Excessive overhead signals a lack of internal control to investors and stakeholders. Unmanaged licenses act as silent budget killers, especially in SMBs where every dollar affects the bottom line. Leadership teams in 2026 recognize that software waste is a leak in the balance sheet. Proper license governance also solves critical security gaps. It ensures that employee offboarding is comprehensive. This prevents "zombie accounts" from draining resources and creating unauthorized access points. Total clarity is the only way to maintain a secure and lean digital environment.
Tracking these microsoft 365 cost optimization kpis allows you to present a narrative of control. You aren't just asking for a budget; you are demonstrating how you protect it. This shift from technical reporting to financial auditing is what earns IT a permanent seat at the leadership table.
5 Critical KPIs to Measure Microsoft 365 Spend and License Waste
Effective management starts with standardized measurement. To protect your budget in 2026, you must track specific microsoft 365 cost optimization kpis that translate technical activity into fiscal reality. Visibility is your only defense against rising subscription costs. These five metrics provide the granular detail needed to identify waste and justify your IT spend to the CFO.
- License Health Score: An aggregate metric measuring the efficiency of your entire tenant.
- Inactive User Ratio: The percentage of assigned licenses showing zero activity over a set period.
- Redundant License Spend: The cost of paying for duplicate capabilities across multiple software vendors.
- M365 Tier Alignment: A calculation of how many users are on plans that exceed their actual feature usage.
- Spend Recovery Potential: The total dollar value of all actionable optimization opportunities identified within the ecosystem.
License Health Score: Your North Star Metric
A single, high-level score is more effective for leadership than presenting a hundred disjointed data points. You calculate this score by weighing assigned licenses against actual feature utilization. If a user has an E5 license but only uses basic email, their individual health score drops. Aggregating these scores across the organization creates a powerful benchmark for efficiency. Integrating this metric into a proactive License Health Score dashboard allows you to monitor fluctuations in real time. Leaders use these metrics to ensure IT investments support their strategy during economic shifts rather than becoming a drain on resources.
Quantifying Inactive and Redundant Licenses
Inactivity thresholds are the foundation of license reclamation. For most M365 apps, a 30-day window identifies fast-moving waste, while a 90-day window confirms a permanent lack of need. Tracking the Inactive User Ratio reveals the delta between what you pay for and what your team actually uses. Redundant License Spend is the cost of paying for duplicate capabilities across vendors, such as maintaining a separate Zoom contract when your E3 licenses already include full Teams functionality. Many organizations lose thousands every month because premium licenses are assigned to users who only perform basic tasks. A Spend Recovery Dashboard provides the immediate visibility required to stop these silent budget leaks. Mastering these microsoft 365 cost optimization kpis ensures your department operates with maximum financial hygiene.
The Boardroom Pitch: How to Present IT Cost Savings to Leadership
Technical metrics alone won't move the needle in a boardroom. To secure executive buy-in, you must translate your microsoft 365 cost optimization kpis into EBITDA impact. Leadership doesn't care about "inactive users" in isolation. They care about trapped capital that could be reinvested into higher-value initiatives. When you present your findings, you aren't just showing a spreadsheet. You're demonstrating financial stewardship and operational control.
Ground your data in a proven Microsoft 365 Cost Optimization strategy to build immediate credibility. High-level executives respond to the language of risk and recovery. Inefficient license management often masks the hidden costs of low performance that erode corporate profit margins. Use a structured 3-Slide Framework to keep your pitch concise and results-oriented:
- Slide 1: The Efficiency Gap. Use your current License Health Score to visualize the delta between paid spend and actual utility.
- Slide 2: The Recovery Plan. Present specific tier-alignment recommendations with a clear dollar value attached to each move.
- Slide 3: The Governance Roadmap. Propose Automated Governance Workflows to ensure these savings are permanent rather than a one-time fix.
The Narrative Shift: From Cost Center to Profit Driver
Frame license reclamation as "found money." When you identify unoptimized spend, you're effectively creating a budget for new projects without requesting additional capital. It's vital to show your Health Score trend over time. A single snapshot is helpful, but a positive trend line proves that your management strategy is working. CFOs often worry that cost-cutting is a temporary measure. Address this concern directly by demonstrating how your microsoft 365 cost optimization kpis are baked into a sustainable, automated system.
Visualizing Waste with Dollar-Value Recommendations
Reporting that 15 users are inactive is a technical observation. Reporting that those 15 users represent $1,200 in monthly waste is a financial insight. Use your Spend Recovery Dashboard to provide real-time validation of these figures. This precision builds trust. It proves that your data isn't a guess. Create urgency by projecting accumulated waste over the entire fiscal year. If you don't act now, that $1,200 monthly leak becomes a $14,400 annual loss. By highlighting the cost of inaction, you transform a technical cleanup task into a high-priority financial mandate.
How to Audit Your M365 Ecosystem: A Step-by-Step Framework
Auditing your tenant requires a clinical, systematic approach. It's the only way to validate your microsoft 365 cost optimization kpis and ensure your reporting is rooted in fact. A structured framework removes the guesswork from license management. It ensures no license remains unexamined and no dollar stays trapped in an underutilized account. Without a clear audit process, your optimization efforts will be reactive and inconsistent.
Step 1: Automated Discovery and Health Checks
Manual audits are obsolete before you even finish the first spreadsheet. They lack the speed to keep up with dynamic user changes and license reassignments. Connecting AI-native tools to your M365 tenant in minutes provides an immediate, accurate baseline of your digital environment. This initial scan identifies every user, license type, and feature usage pattern across your entire organization. For deeper audit steps, check out the Microsoft 365 License Optimization guide. Automation is the only way to achieve the real-time visibility needed for modern financial hygiene.
Step 2: Right-Sizing and Reclamation
Analysis leads directly to action. During this phase, you must benchmark current usage against specific license tiers. Identify users on premium E5 plans who only require E3 or Business Standard features. This right-sizing process is the fastest way to improve your microsoft 365 cost optimization kpis and recover budget. Implementing an Office 365 Offboarding Checklist ensures instant recovery of licenses from departed employees. By automating the governance of unassigned licenses, you prevent waste from creeping back into your system during high-growth periods.
Execution happens through Automated Governance Workflows. These systems handle the heavy lifting of license reclamation without manual intervention from your IT team. Once reclamation is complete, you must close the loop with a post-optimization health report. This document compares your "before" and "after" metrics to prove the success of your audit framework. It serves as your definitive proof of performance for leadership. You can start your automated audit today with LicenseIQ to uncover obscured waste and secure your resources.
A successful audit framework consists of four distinct stages:
- Discovery: Scanning every license and user for total tenant visibility.
- Analysis: Benchmarking feature usage to find downgrade opportunities.
- Execution: Reclaiming licenses through automated offboarding and workflows.
- Reporting: Documenting recovered capital and improved health scores.
This disciplined approach transforms your M365 environment from a chaotic expense into a lean, high-performance asset. It provides the transparency required to defend your budget against future price increases.
Automated Governance: The Future of SaaS Financial Hygiene
Manual oversight is a liability. In a landscape where license costs fluctuate and usage patterns shift daily, a "set-and-forget" approach to governance is the only way to maintain your microsoft 365 cost optimization kpis. Relying on annual or quarterly reviews ensures that you'll always be behind the curve. Automated systems act as a vigilant digital auditor. They provide the persistent oversight necessary to keep your digital resources aligned with your actual operational requirements.
AI plays a critical role in this evolution. It doesn't just track current data; it predicts future needs and identifies anomalies before they become budget-draining trends. If a department suddenly assigns 50 premium licenses without a corresponding increase in project activity, the system flags the irregularity instantly. Moving from manual tracking to the LicenseIQ Platform allows organizations to achieve up to 35% automated spend recovery. This transition replaces human error with algorithmic precision. The ROI of automated license governance far exceeds manual IT asset management by eliminating the labor costs associated with forensic data collection.
Continuous Monitoring vs. Annual Audits
A License Health Score is only useful if it's current. Annual audits provide a snapshot of the past, but automated Governance Workflows offer a live feed of your financial health. This real-time visibility prevents waste from creeping back into the tenant after a cleanup. When you automate the reclamation of inactive seats, you reduce the administrative burden on your IT team by up to 90%. They stop being data entry clerks and start being strategic architects. Continuous monitoring ensures that your microsoft 365 cost optimization kpis remain optimized every day of the fiscal year.
Next Steps: Recovering Your First $1,000 in 5 Minutes
Efficiency doesn't require months of planning. Our 5-minute audit philosophy focuses on immediate leadership buy-in by identifying low-hanging fruit instantly. You don't need a complex roadmap to start saving. By connecting your tenant to a real-time Spend Recovery Dashboard, you can visualize exactly where capital is trapped. This immediate clarity builds the confidence needed to implement broader governance changes. Stop guessing about your software spend and start managing it with surgical precision. Start your health check on the LicenseIQ platform today and secure your organization's financial future.
- Immediate Insight: Connect your tenant and see your License Health Score in minutes.
- Predictive Intelligence: Use AI to forecast licensing needs and prevent over-provisioning.
- Permanent Recovery: Deploy workflows that automatically reclaim inactive licenses.
- Strategic Reporting: Deliver boardroom-ready data that proves IT’s value to the bottom line.
Secure Your 2026 IT Budget with Data-Driven Clarity
Mastering your SaaS ecosystem requires a fundamental shift in how you report value to leadership. By focusing on License Health Scores and Spend Recovery Potential, you provide the transparency necessary to navigate the global price increases scheduled for July 2026. This data-driven approach ensures that every dollar in your budget is actively supporting your organization's growth rather than leaking through inactive accounts.
Automating these microsoft 365 cost optimization kpis removes the administrative burden from your technical team. You don't have to spend weeks on manual audits that are obsolete by the time they're finished. Instead, use a system that monitors your resources with surgical precision and identifies waste as it happens. This proactive stance turns IT into a profit driver by recovering trapped capital for new initiatives.
Take the first step toward total financial hygiene today. Scan your M365 tenant for free and find your License Health Score now. Our platform connects in minutes to provide actionable dollar-value insights and uses AI-native automated governance workflows to help you save up to 35% on software subscriptions. You have the power to reclaim your resources and lead with confidence.
Frequently Asked Questions
What are the most important KPIs for Microsoft 365 cost optimization?
The most critical microsoft 365 cost optimization kpis include the License Health Score, Inactive User Ratio, and Spend Recovery Potential. These metrics provide a clear view of where capital is trapped and how efficiently your current subscriptions are being utilized across the organization. By tracking these specific data points, you can move away from vague adoption numbers and focus on the actual financial health of your tenant.
How do I calculate the ROI of a SaaS management platform?
Calculate ROI by comparing the total dollar value of recovered licenses against the annual cost of your management platform. Focus on the "net recovery" figure to show leadership the direct impact on the bottom line. This calculation should include both immediate savings from reclaimed seats and long-term avoidance of unnecessary renewals. A high-performing platform typically pays for itself within the first few months by identifying obscured waste.
How can I present IT cost savings to my CFO effectively?
Present savings by focusing on EBITDA impact and "recovered cash" rather than technical jargon. CFOs value precision, so use a Spend Recovery Dashboard to show specific dollar-value recommendations for every license tier. Lead with the financial benefit to secure immediate executive alignment. Showing a projection of accumulated annual waste if no action is taken creates the urgency needed for a successful pitch.
What is a good License Health Score for an SMB?
An ideal License Health Score for an SMB is 90% or higher. If your score falls below 80%, you're likely overpaying for features your team doesn't use or maintaining "zombie" accounts for former employees. Real-time monitoring ensures this score remains high as your team scales. Maintaining a high score proves to leadership that IT resources are being managed with surgical precision and total transparency.
How often should I audit my Microsoft 365 licenses?
You should audit your licenses continuously using automated tools rather than relying on manual periodic reviews. Manual audits are static and quickly become inaccurate in dynamic cloud environments where users are added or removed daily. Continuous oversight allows you to identify waste the moment it occurs, ensuring your microsoft 365 cost optimization kpis stay on target without requiring hundreds of manual labor hours.
What is the difference between SaaS spend management and IT asset management?
IT asset management typically focuses on the physical lifecycle of hardware and software compliance. SaaS spend management is a specialized discipline centered on subscription efficiency and financial hygiene. It prioritizes license utilization and feature-tier alignment to prevent budget leaks. While ITAM ensures you have the right tools, SaaS spend management ensures you aren't overpaying for the tools you already have.
Can I automate the reclamation of inactive Microsoft 365 licenses?
Yes, you can fully automate license reclamation using Automated Governance Workflows. These systems detect inactivity based on pre-set thresholds, such as 30 or 90 days, and automatically trigger offboarding or downgrading tasks. This eliminates manual intervention and ensures your tenant remains lean without constant IT supervision. Automation is the only way to maintain SaaS hygiene at scale without increasing your department's headcount.
How much can a typical company save through license optimization?
Companies often recover up to 35% of their software spend by right-sizing tiers and reclaiming inactive seats. The exact figure depends on your current License Health Score and the complexity of your tenant environment. Using a Spend Recovery Dashboard provides the immediate visibility needed to quantify these specific savings. Most organizations find that they are paying for significantly more premium features than their users actually require.


