
Gartner research indicates that organizations waste up to 30% of their SaaS budget on underutilized or redundant licenses. You already know that your Microsoft 365 environment is likely leaking capital, but trying to prove it with a 50-page technical audit won't work. To get results, you need a Health Score for the C-Suite: Reporting Microsoft 365 Cost Health in One Number. Your CFO and CIO don't have time to sift through manual spreadsheets or interpret raw usage logs. They need immediate visibility to make informed financial decisions without the noise of technical jargon.
This article teaches you how to distill complex licensing data into a single, authoritative metric that quantifies waste and identifies optimization opportunities instantly. We'll explore how to automate your reporting workflows, eliminate the 15% error rate typical of manual audits, and provide the transparency required to secure faster executive approval for budget shifts. By the end, you'll have a clear roadmap to transform your M365 environment into a model of financial efficiency and eliminate the unknown spend that threatens your bottom line. It's time to turn your software stack from a cost center into a lean, optimized asset.
Key Takeaways
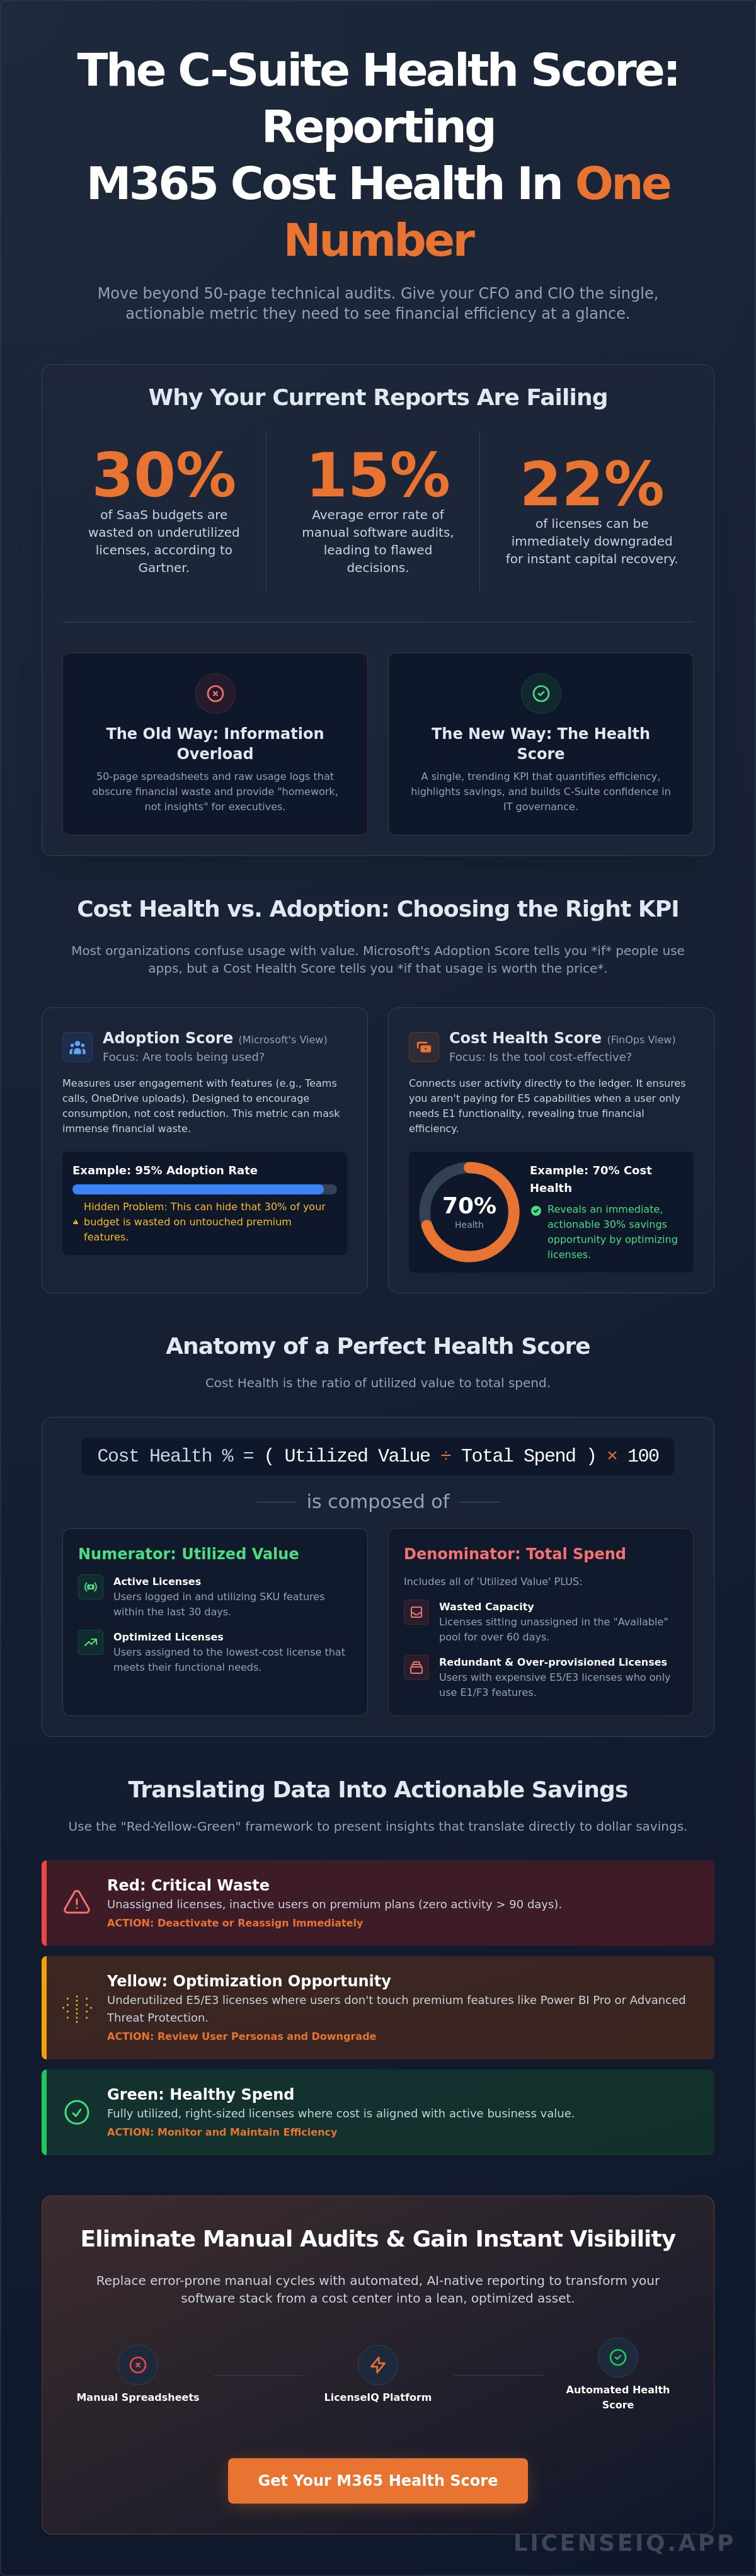
- Shift your focus from simple user counts to a single, actionable percentage that quantifies the financial health of your Microsoft 365 tenant.
- Understand the critical distinction between adoption and cost efficiency by implementing a Health Score for the C-Suite: Reporting Microsoft 365 Cost Health in One Number.
- Pinpoint financial waste by auditing the four pillars of license health, ensuring every user persona matches their assigned tier.
- Use the "Red-Yellow-Green" framework to present data-driven insights that translate technical licensing metrics into actual dollar savings for the board.
- Eliminate manual audit cycles and gain instant visibility into your software stack through automated, AI-native reporting tools.
What is a Microsoft 365 Cost Health Score?
A Microsoft 365 Cost Health Score is a single, objective percentage. It represents the financial efficiency of your entire tenant. It tells you exactly how much of your monthly investment actually translates into active business value. Most organizations manage their software through technical logs, but this metric changes the focus. It moves the conversation from "how many users do we have" to "how much value are we capturing."
By 2026, 80% of C-Suite leaders will demand simplified SaaS metrics over traditional technical exports. They no longer want to see thousands of rows of usage data. They want one number that proves fiscal responsibility. Implementing a Health Score for the C-Suite: Reporting Microsoft 365 Cost Health in One Number provides the clarity needed to justify enterprise renewals and prevent budget bloat.
There's a critical difference between a technical Adoption Score and a financial Health Score. Microsoft's native tools measure how people use features like Teams or OneDrive. However, they don't account for the price paid for those features. A Cost Health Score bridges this gap. It connects user activity directly to the ledger, ensuring you aren't paying for E5 capabilities when a user only requires E1 functionality. Visibility is the antidote to waste; it's how you turn a black box into a transparent asset.
The Anatomy of a Perfect Health Score
To calculate this metric, you must look at two specific data points. The numerator consists of active, optimized licenses that are currently in use by employees. The denominator includes your total subscription spend, including unassigned capacity and redundant licenses. This calculation serves as a critical Key Performance Indicator for IT governance. Cost Health is the ratio of utilized value to total spend.
- Active Licenses: Users who have logged in and utilized their assigned SKU features within the last 30 days.
- Optimized Licenses: Users assigned to the lowest-cost license that still meets their functional needs.
- Wasted Capacity: Licenses sitting in the "Available" pool that haven't been assigned for over 60 days.
Why CFOs Are Ignoring Your Current Reports
Standard Microsoft Admin Center exports often lead to the "Information Overload" trap. When you present a 50-page spreadsheet to a CFO, you aren't providing insights; you're providing homework. Raw user counts fail to show spend recovery opportunities. They don't highlight the 22% of licenses that could be downgraded to save immediate capital.
CFOs demand a single, trending KPI that they can track month-over-month. A Health Score for the C-Suite: Reporting Microsoft 365 Cost Health in One Number creates psychological confidence during board meetings. It demonstrates that IT is a proactive digital auditor rather than a passive cost center. Using a platform like LicenseIQ allows you to surface these hidden costs automatically, turning chaotic software stacks into streamlined financial assets.
Cost Health vs. Adoption Score: Choosing the Right KPI
Most organizations confuse usage with value. Microsoft provides an Adoption Score to track how frequently employees engage with specific apps. This metric tells you if people use Teams or Excel, but it fails to mention what those interactions cost the business. You can achieve a 95% adoption rate while simultaneously wasting 30% of your software budget on premium features that remain untouched. This disconnect is why a Health Score for the C-Suite: Reporting Microsoft 365 Cost Health in One Number is essential for modern financial oversight.
Relying on native metrics for financial audits is a mistake. Microsoft's reporting is designed to encourage consumption, not to reduce your monthly bill. When you transition from IT-centric views to FinOps-centric reporting, the focus shifts from "is the tool active" to "is the tool cost-effective." This change in perspective allows leaders to treat software as a managed asset rather than a fixed utility cost. It replaces the chaos of unknown spend with total visibility.
Technical Health (Microsoft's View)
Microsoft prioritizes operational stability and feature depth. Their dashboard tracks app versions, security patch compliance, and general activity levels. While these data points are vital for IT stability, they're often irrelevant for budget optimization. An IT manager might see a healthy tenant because 98% of devices are running the latest build. However, this technical success masks financial failure if those users are over-provisioned. Understanding the nuances of different Microsoft 365 License Types is the first step in identifying these technical versus financial gaps.
Cost Health (LicenseIQ's View)
Cost Health focuses exclusively on the bottom line. It uncovers unassigned licenses, identifies inactive users, and highlights redundant subscription tiers that bloat the budget. In typical SMB environments, this focus directly correlates to a 35% potential reduction in annual spend. By implementing automated license governance, companies move away from manual spreadsheets and toward real-time visibility. This proactive approach ensures that the Health Score for the C-Suite: Reporting Microsoft 365 Cost Health in One Number remains high, protecting corporate resources from the shadow IT and license sprawl that often go unnoticed in standard reports.
If you want to stop overpaying for seats your team doesn't use, it's time to audit your current utilization and reclaim your budget.
The 4 Pillars of a 2026 M365 Health Score
To produce an accurate Health Score for the C-Suite: Reporting Microsoft 365 Cost Health in One Number, you must track four critical pillars. These metrics provide the visibility required to eliminate waste and secure your environment. Without these specific benchmarks, your cloud spend remains a black box that hides inefficiencies. By quantifying these areas, you transform abstract SaaS costs into actionable intelligence for the board.
- Utilization Rate: This tracks the percentage of assigned licenses showing active login activity. High utilization indicates your team actually uses the tools you've purchased.
- Assignment Accuracy: This evaluates how well you match user personas to license tiers. It stops you from over-provisioning expensive E5 licenses to users who only require the core features of E3.
- Waste Ratio: This represents the total dollar value of unassigned or redundant licenses. It's the most direct indicator of financial leakage within your IT budget.
- Offboarding Velocity: This measures the speed of license reclamation. Top-performing organizations reclaim licenses within 24 hours of an employee's departure to maximize savings.
Focusing on these four pillars creates a culture of accountability. It moves IT from a cost center to a strategic partner focused on optimization. Precision in these areas ensures your organization isn't part of the 30% of companies that overspend on cloud software annually. This data-driven approach provides the transparency necessary for modern financial governance.
Identifying Inactive User Waste
In 2026, the 30-day threshold is the gold standard for defining an inactive user. If an account hasn't logged in within a month, it's a financial drain. Dormant accounts also represent a significant security threat. They often lack active monitoring, making them prime targets for unauthorized access. To stop the bleed, use a structured Office 365 Offboarding Checklist to reclaim spend and secure data. Rapid reclamation prevents "zombie" licenses from inflating your monthly bill and improves your total score.
Right-Sizing Tiers for SMBs
SMBs often suffer from the "E5 Gap," where they pay for advanced compliance or voice features that remain untouched by the workforce. This misalignment skews your metrics and wastes capital. Implementing persona-based licensing allows you to assign specific tiers based on actual daily tasks and departmental needs. 100% health requires 0% redundant feature overlap. By auditing your feature usage, you ensure every dollar spent contributes to productivity. This level of detail is essential for a meaningful Health Score for the C-Suite: Reporting Microsoft 365 Cost Health in One Number.
Reporting to the Board: How to Present the Number
Data without context is noise. To make the Health Score for the C-Suite: Reporting Microsoft 365 Cost Health in One Number effective, you must present it through a lens of financial accountability. Executives don't want technical spreadsheets; they want a binary status of optimized or wasteful. It's about providing a clear signal in a high-noise environment.
The Red-Yellow-Green framework provides this immediate clarity. A score below 60 is Red, indicating critical waste and security gaps. 60 to 85 is Yellow, showing progress but leaving significant capital on the table. Above 85 is Green, the gold standard for lean operations. By translating this score into Annualized Spend Recovery dollars, you move the conversation from IT costs to bottom-line impact. If your score is 65, tell the board it represents $140,000 in recoverable capital. Use trend lines to demonstrate that IT is actively strangling SaaS sprawl before it scales. Set a firm Target Health Score for the next fiscal quarter to establish a culture of continuous improvement and fiscal discipline.
The 3-Slide Executive Deck
Keep your presentation lean. Focus on these three high-impact slides to drive decision-making and secure buy-in for your optimization initiatives.
- Slide 1: The Benchmark. Display your current score against an industry average of 78. This creates a competitive baseline that resonates with board members.
- Slide 2: Immediate Recovery. List the top three Quick Wins. For example, reclaiming 52 inactive E5 licenses can save thousands of dollars per month instantly.
- Slide 3: The Roadmap. Detail the projected ROI of Microsoft 365 license optimization to show how automated management sustains these gains over time.
Handling Common CFO Objections
CFOs are paid to be skeptical. When they ask why Microsoft isn't providing these insights, be direct. Microsoft's business model thrives on consumption, not your savings. Their native tools often lack the granular, cross-tenant visibility required for true optimization. Justify the cost of management tools by pointing to guaranteed spend recovery. Most organizations see a full return on investment within 90 days of implementation. Finally, link cost to security. Every unused, unmonitored license is a potential entry point for a breach. High health scores signify a lower risk profile, which protects the company's reputation and its wallet. It's time to stop guessing and start measuring with precision.
Automating Your Health Score with LicenseIQ
Manual audits belong in the past. Spreadsheets can't keep pace with the 700+ updates Microsoft pushes to 365 annually. Relying on human data entry leads to stale insights and missed savings. LicenseIQ eliminates this friction by deploying an AI-native platform designed for speed. It's time to stop guessing and start measuring with precision. Our system replaces months of manual labor with an automated engine that understands the nuances of enterprise licensing.
The platform generates your score in minutes. You don't need months of consulting engagements to see where capital is leaking. By aggregating usage data across your entire tenant, LicenseIQ identifies unassigned licenses and redundant tiers instantly. This visibility transforms the Health Score for the C-Suite: Reporting Microsoft 365 Cost Health in One Number from a static report into a dynamic financial lever. We deliver a 35% savings promise by focusing on actual utilization rather than projected needs. This isn't just a suggestion; it's a roadmap to immediate recovery.
Moving from reactive reporting to continuous governance is the only way to maintain a lean stack. When you automate the process, you remove the risk of human error and the lag of quarterly reviews. You gain a vigilant digital auditor that works around the clock to protect your bottom line.
Minutes to Visibility
Security is the foundation of our integration. You can connect your tenant securely via the Model Context Protocol. This modern standard ensures data integrity while providing the engine with the raw telemetry it needs to calculate your score. Once connected, the dashboard reveals wasted spend immediately. You'll see clear recovery paths for inactive accounts and over-provisioned users. Don't wait for the next renewal cycle to find out you've been overpaying. Start your audit at licenseiq.app today and see the truth behind your tenant data.
Continuous Financial Hygiene
One-off cleanups don't solve the long-term problem. Waste creeps back in the moment you look away. LicenseIQ provides continuous governance through automated alerts. If your score drops due to new unassigned licenses or a spike in shadow IT, you'll know instantly. This shift empowers IT teams to function as profit centers. Instead of just managing costs, they actively recover capital for the business. It's about maintaining a pristine environment every day of the year. The Health Score for the C-Suite: Reporting Microsoft 365 Cost Health in One Number ensures that every dollar spent is a dollar utilized. Discover your M365 Health Score today and take command of your digital spend.
Turn Visibility into Financial Velocity
Modern IT leadership requires more than just tracking user logins. You need a unified metric that translates technical utilization into fiscal accountability. By moving beyond basic adoption scores and embracing the four pillars of 2026 governance, you'll eliminate the waste that typically plagues unmanaged SaaS stacks. This transition transforms your department from a cost center into an optimized strategic asset. It's about ensuring every license delivers maximum value to the bottom line.
Implementing a Health Score for the C-Suite: Reporting Microsoft 365 Cost Health in One Number provides the immediate transparency your board demands. It replaces manual, error-prone spreadsheets with a single, authoritative data point. LicenseIQ streamlines this process by delivering AI-native automated governance that uncovers hidden inefficiencies across your entire environment. You can connect to your tenant in minutes and start identifying ways to save up to 35% on M365 spend immediately. Don't let your budget disappear into the shadows of unmanaged software.
Stop guessing about your license efficiency and start leading with data-driven precision. The path to total visibility is shorter than you think, and the financial rewards are substantial.
Discover your M365 Health Score in 5 minutes with LicenseIQ
Frequently Asked Questions
What is a 'good' Microsoft 365 Health Score for an SMB?
A score of 90% or higher represents the gold standard for SMB efficiency. Most organizations start at 65% due to inactive accounts and unassigned licenses. Aiming for 90% ensures you've eliminated at least 25% of waste. This benchmark indicates that 9 out of 10 dollars spent contribute directly to active user productivity. High scores prove your IT department is a value center, not a cost center.
Can I calculate my Cost Health Score using just the Microsoft Admin Center?
No, the Microsoft Admin Center provides raw usage data but lacks the financial context needed for a comprehensive Health Score for the C-Suite: Reporting Microsoft 365 Cost Health in One Number. You can see if a user logged in within 30 days, but you can't automatically correlate that with contract unit prices or downgrade opportunities. Manual calculation requires exporting 3 different CSV files and several hours of spreadsheet analysis.
How often should I report the Health Score to the C-Suite?
You should deliver a Health Score report on the first Tuesday of every month. Monthly reporting aligns with standard billing cycles and allows CFOs to track 12 distinct data points per year. This frequency catches license creep before it compounds into a 15% budget overage by year end. Quarterly reporting is too slow to stop monthly recurring revenue leaks that drain your annual budget.
Does a high Health Score mean we are less secure?
A high score actually increases security by eliminating 100% of zombie accounts that hackers often exploit. When you remove inactive licenses, you shrink your attack surface. Cost health and security health are symbiotic. A lean environment is easier to audit and monitor than one cluttered with 50 unassigned E5 licenses. Precise management prevents the 20% of breaches that stem from unmanaged identities.
What is the difference between license utilization and license health?
Utilization measures if a license is assigned; health measures if that license is the right fit for the user's actual behavior. You might have 100% utilization but poor health if 40 users have an E5 license while only using E1 features. Health Score for the C-Suite: Reporting Microsoft 365 Cost Health in One Number focuses on this financial alignment rather than just seat counts.
Can LicenseIQ automate the reporting of this score to my CFO?
LicenseIQ automates the entire reporting workflow by delivering a PDF summary directly to your CFO's inbox. It eliminates the 4 hours IT managers typically spend aggregating data each month. The system monitors your environment 24/7 and flags deviations immediately. You get total visibility without touching a single Excel macro or running manual PowerShell scripts. Automation ensures your reporting is never delayed by internal projects.
How do I explain a dropping Health Score to my manager?
Frame a dropping score as a specific savings opportunity rather than a failure. If your score drops from 85% to 78%, identify the 7% gap as 14 new inactive accounts created during the last hiring surge. Use this data to justify a 10 minute cleanup session. Transparency turns a negative trend into a proactive win for the department's budget and demonstrates your meticulous control over resources.